Monitoring the Health of KurrentDB Clusters Part 1
A healthy KurrentDB cluster is vital for the performance and reliability of your systems. Proactive monitoring helps you detect and resolve potential problems before they escalate into outages.
This two-part series will guide you through the essential aspects of monitoring a KurrentDB cluster. In part 1, we’ll dive into metrics-based monitoring, covering key performance indicators from IOPS and memory to CPU and disk utilization. In part 2, we’ll explore log-based monitoring and share general tips for maintaining cluster health.
Note that this guide is based on KurrentDB Server version 25.0. For the full and latest version of this guide, please visit Kurrent Documentations’s Monitoring Best Practices Page.
Background
When monitoring the health of a KurrentDB cluster, one should investigate and alert on multiple factors. Here we discuss them in detail
Metrics-based Monitoring
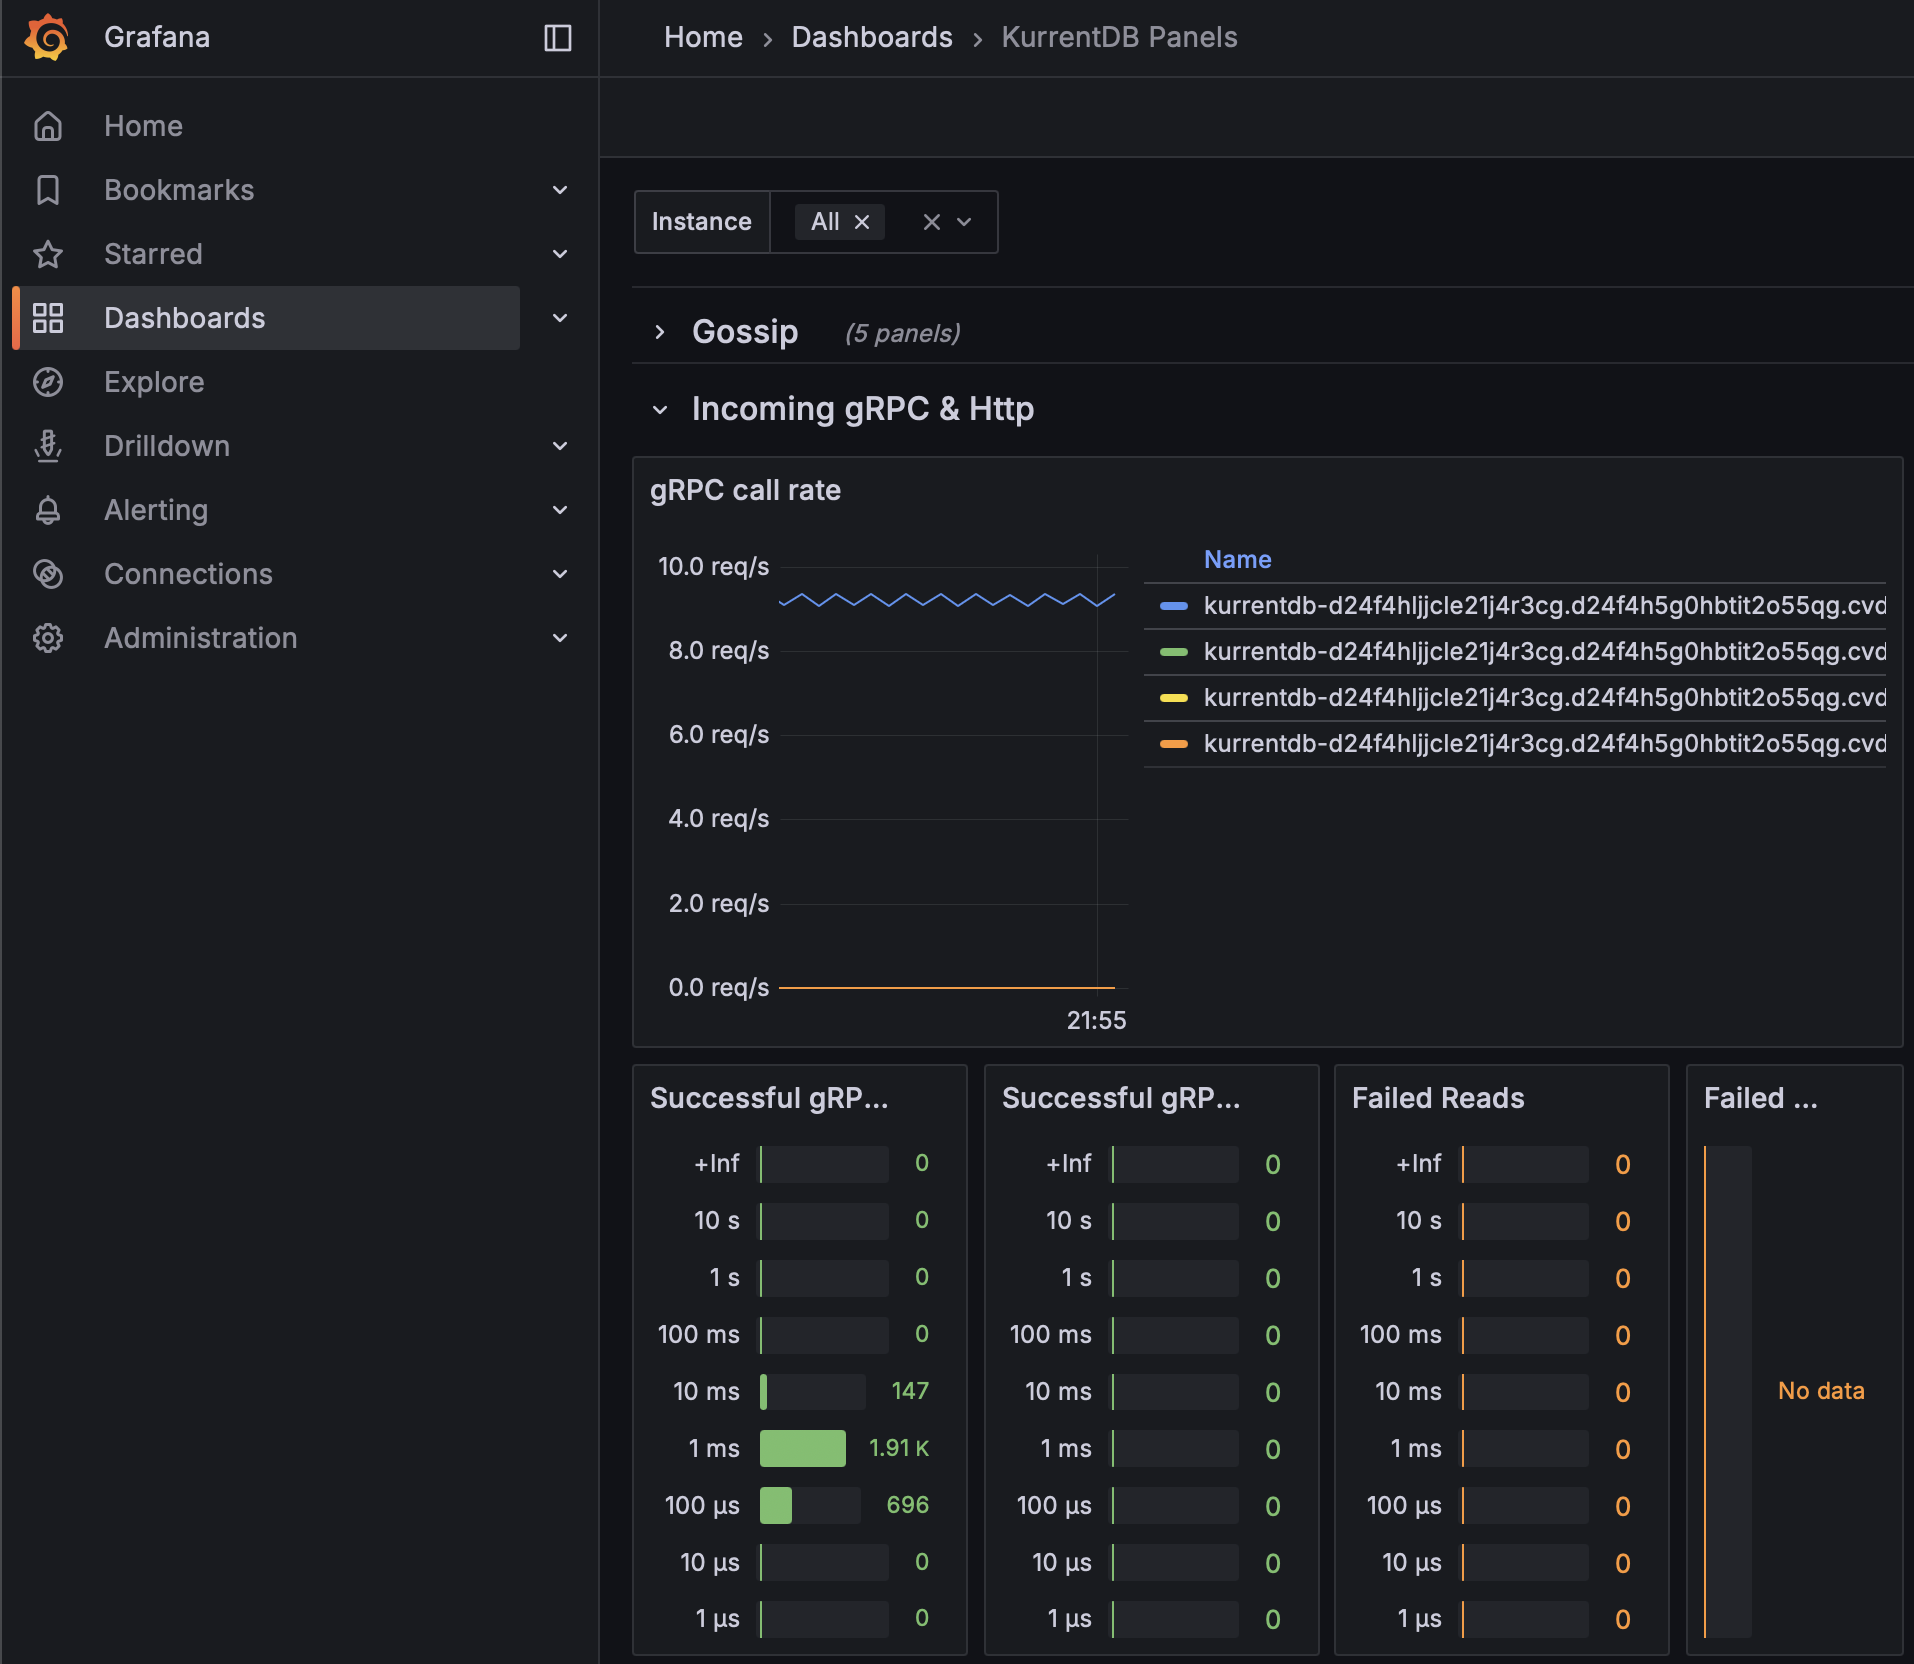
The items in this section can be monitored using metrics from KurrentDB’s Prometheus endpoint / Grafana dashboard, or via metrics from the operating system / machine / cloud provider
IOPS
One should monitor IOPS usage to ensure it does not increase over 80% of allocation. This should take place at the operating system or machine level
One should also evaluate IOPS bursts during extremely heavy periods, start of day / week, etc. to ensure they do not cause exhaustion. This should take place at the operating system or machine level
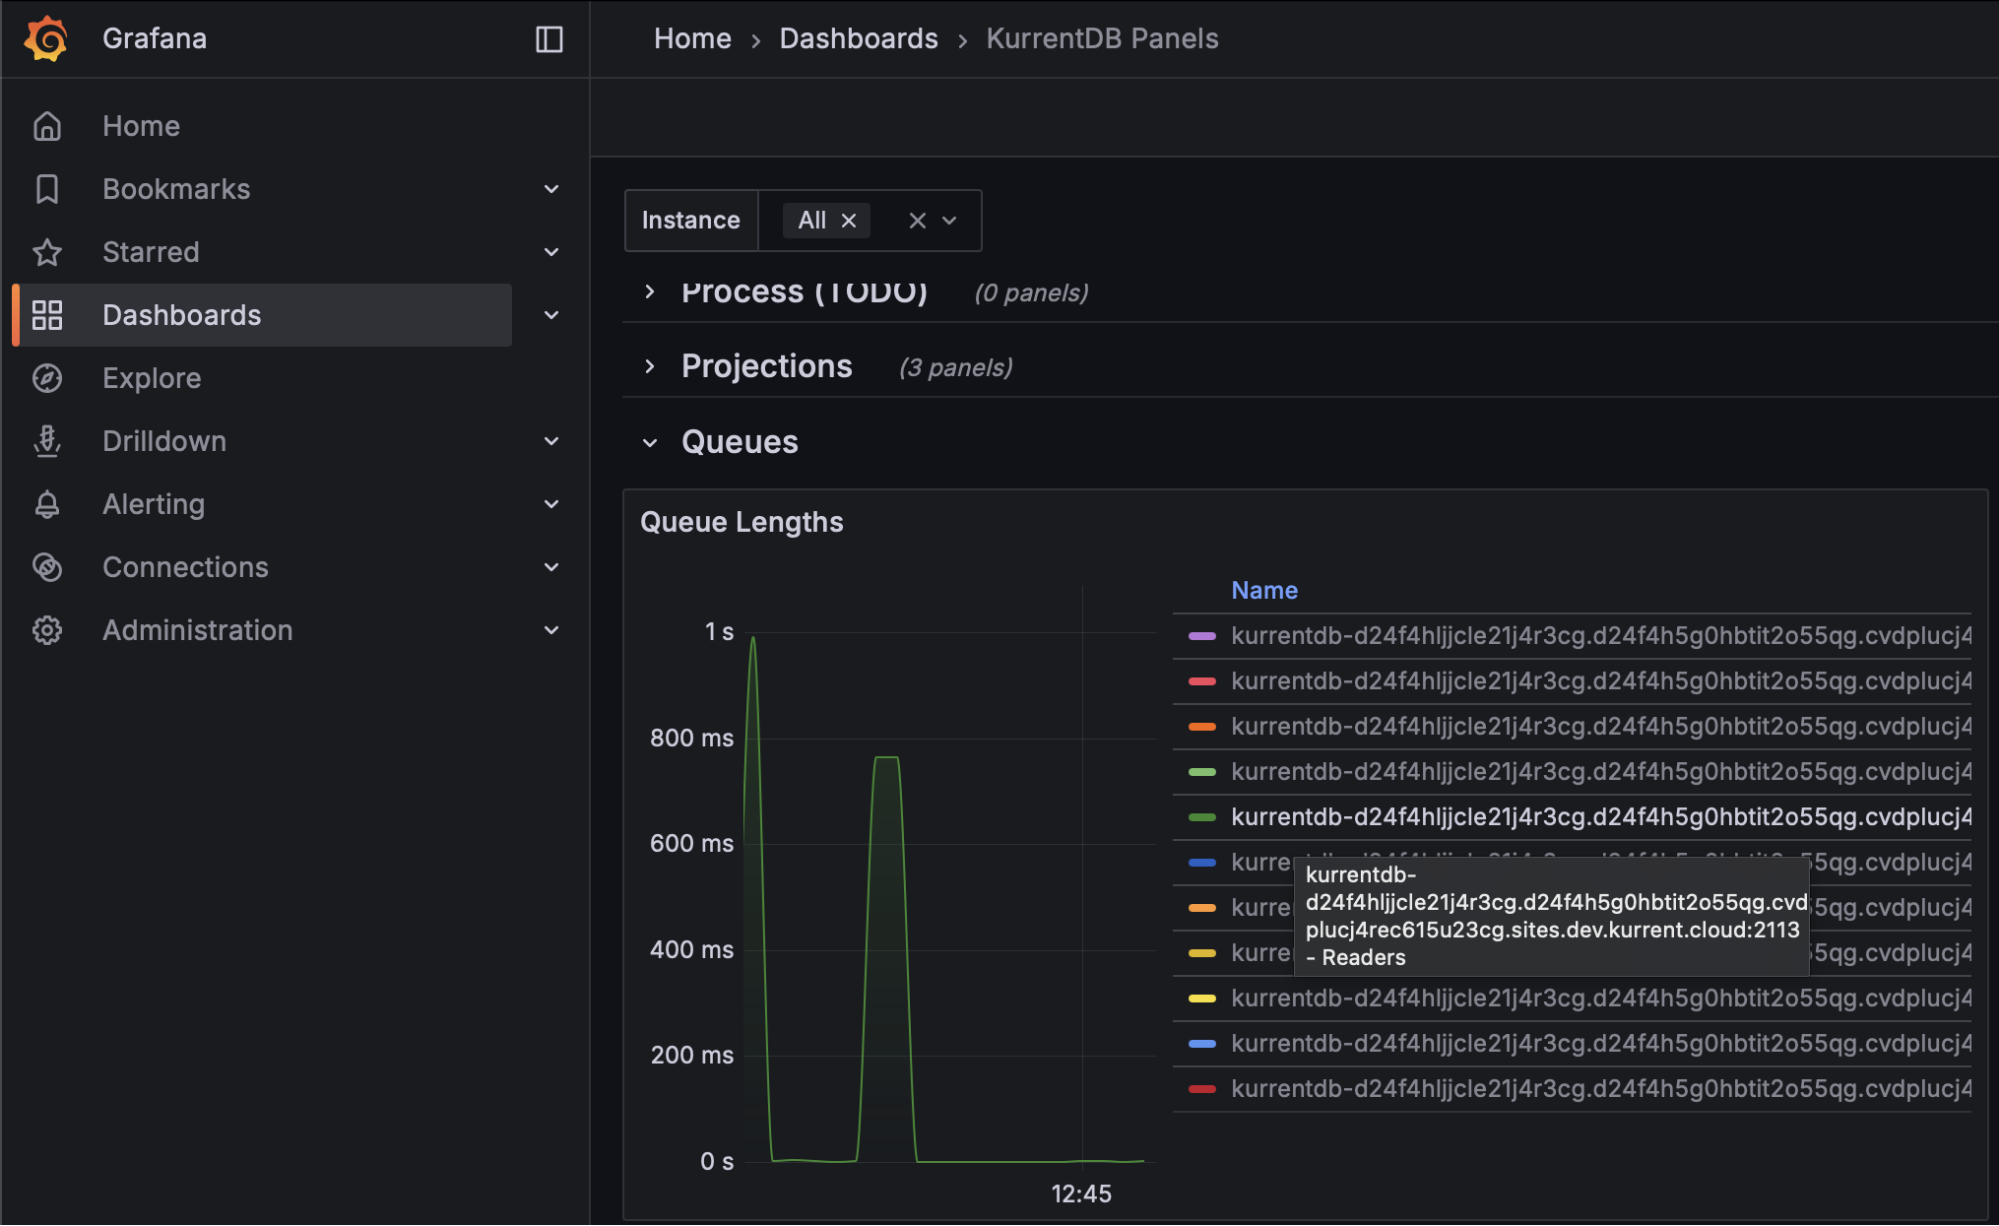
Finally, monitoring reader queue lengths would help organizations understand if IOPS are exhausted as these queues will continue to grow in length, meaning the server never catches up with all read requests. This should take place using Kurrent’s Grafana Dashboard
At the first signs of IOPS exhaustion, customers are advised to increase their IOPS limits
Memory Utilization
As a database, we seek to use memory efficiently for improved processing. Organizations should perform a memory capacity confirmation test to establish baseline utilization, and monitoring should be performed to look for deviations from this baseline.
Further, monitoring at the operating system level to ensure that memory utilization does not exceed 85% of physical memory helps mitigate allocation exceptions
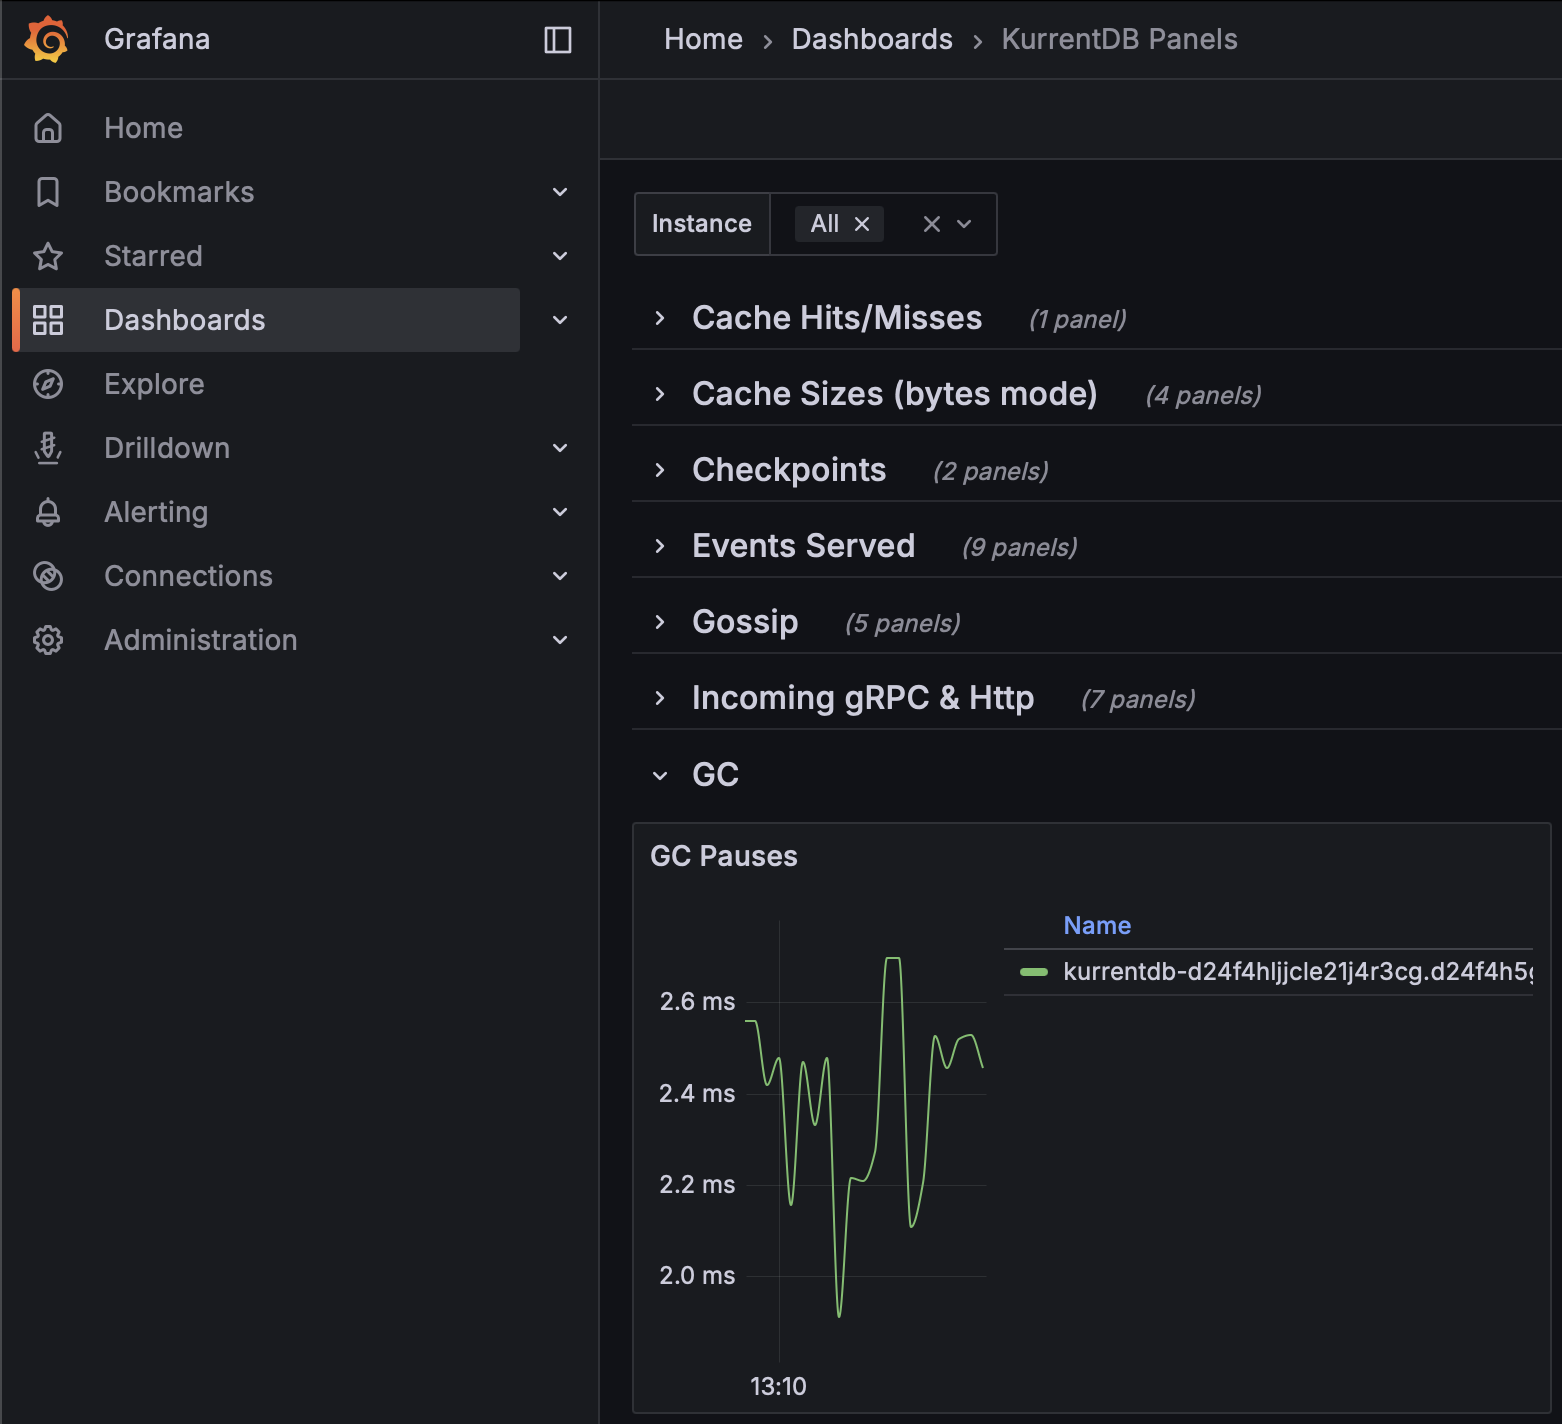
Garbage Collection Pauses
Garbage collection monitoring is largely concerned with gen2 memory, where longer-lived objects are allocated. The length of application pauses for compacting garbage collection of this generation should be monitored using the Kurrent Grafana Dashboard. Steadily increasing durations may eventually cause a leader election as the database will be unresponsive to heartbeats during compacting garbage collections. Monitor this metric to be below the configured Heartbeat Timeout value (default is 10 seconds, so for most customers, 8 seconds should be appropriate)
To mitigate the impact of compacting garbage collection, KurrentDB 25.1 and above automatically uses the ServerGC algorithm. If you are using a version of KurrentDB below 25.1, it can be enabled with the following environment variables:
- DOTNET_gcServer set to 1
- DOTNET_GCHeapHardLimitPercent set to 3C (which is 60 in HEX)
On startup, KurrentDB will log that it is using ServerGC:
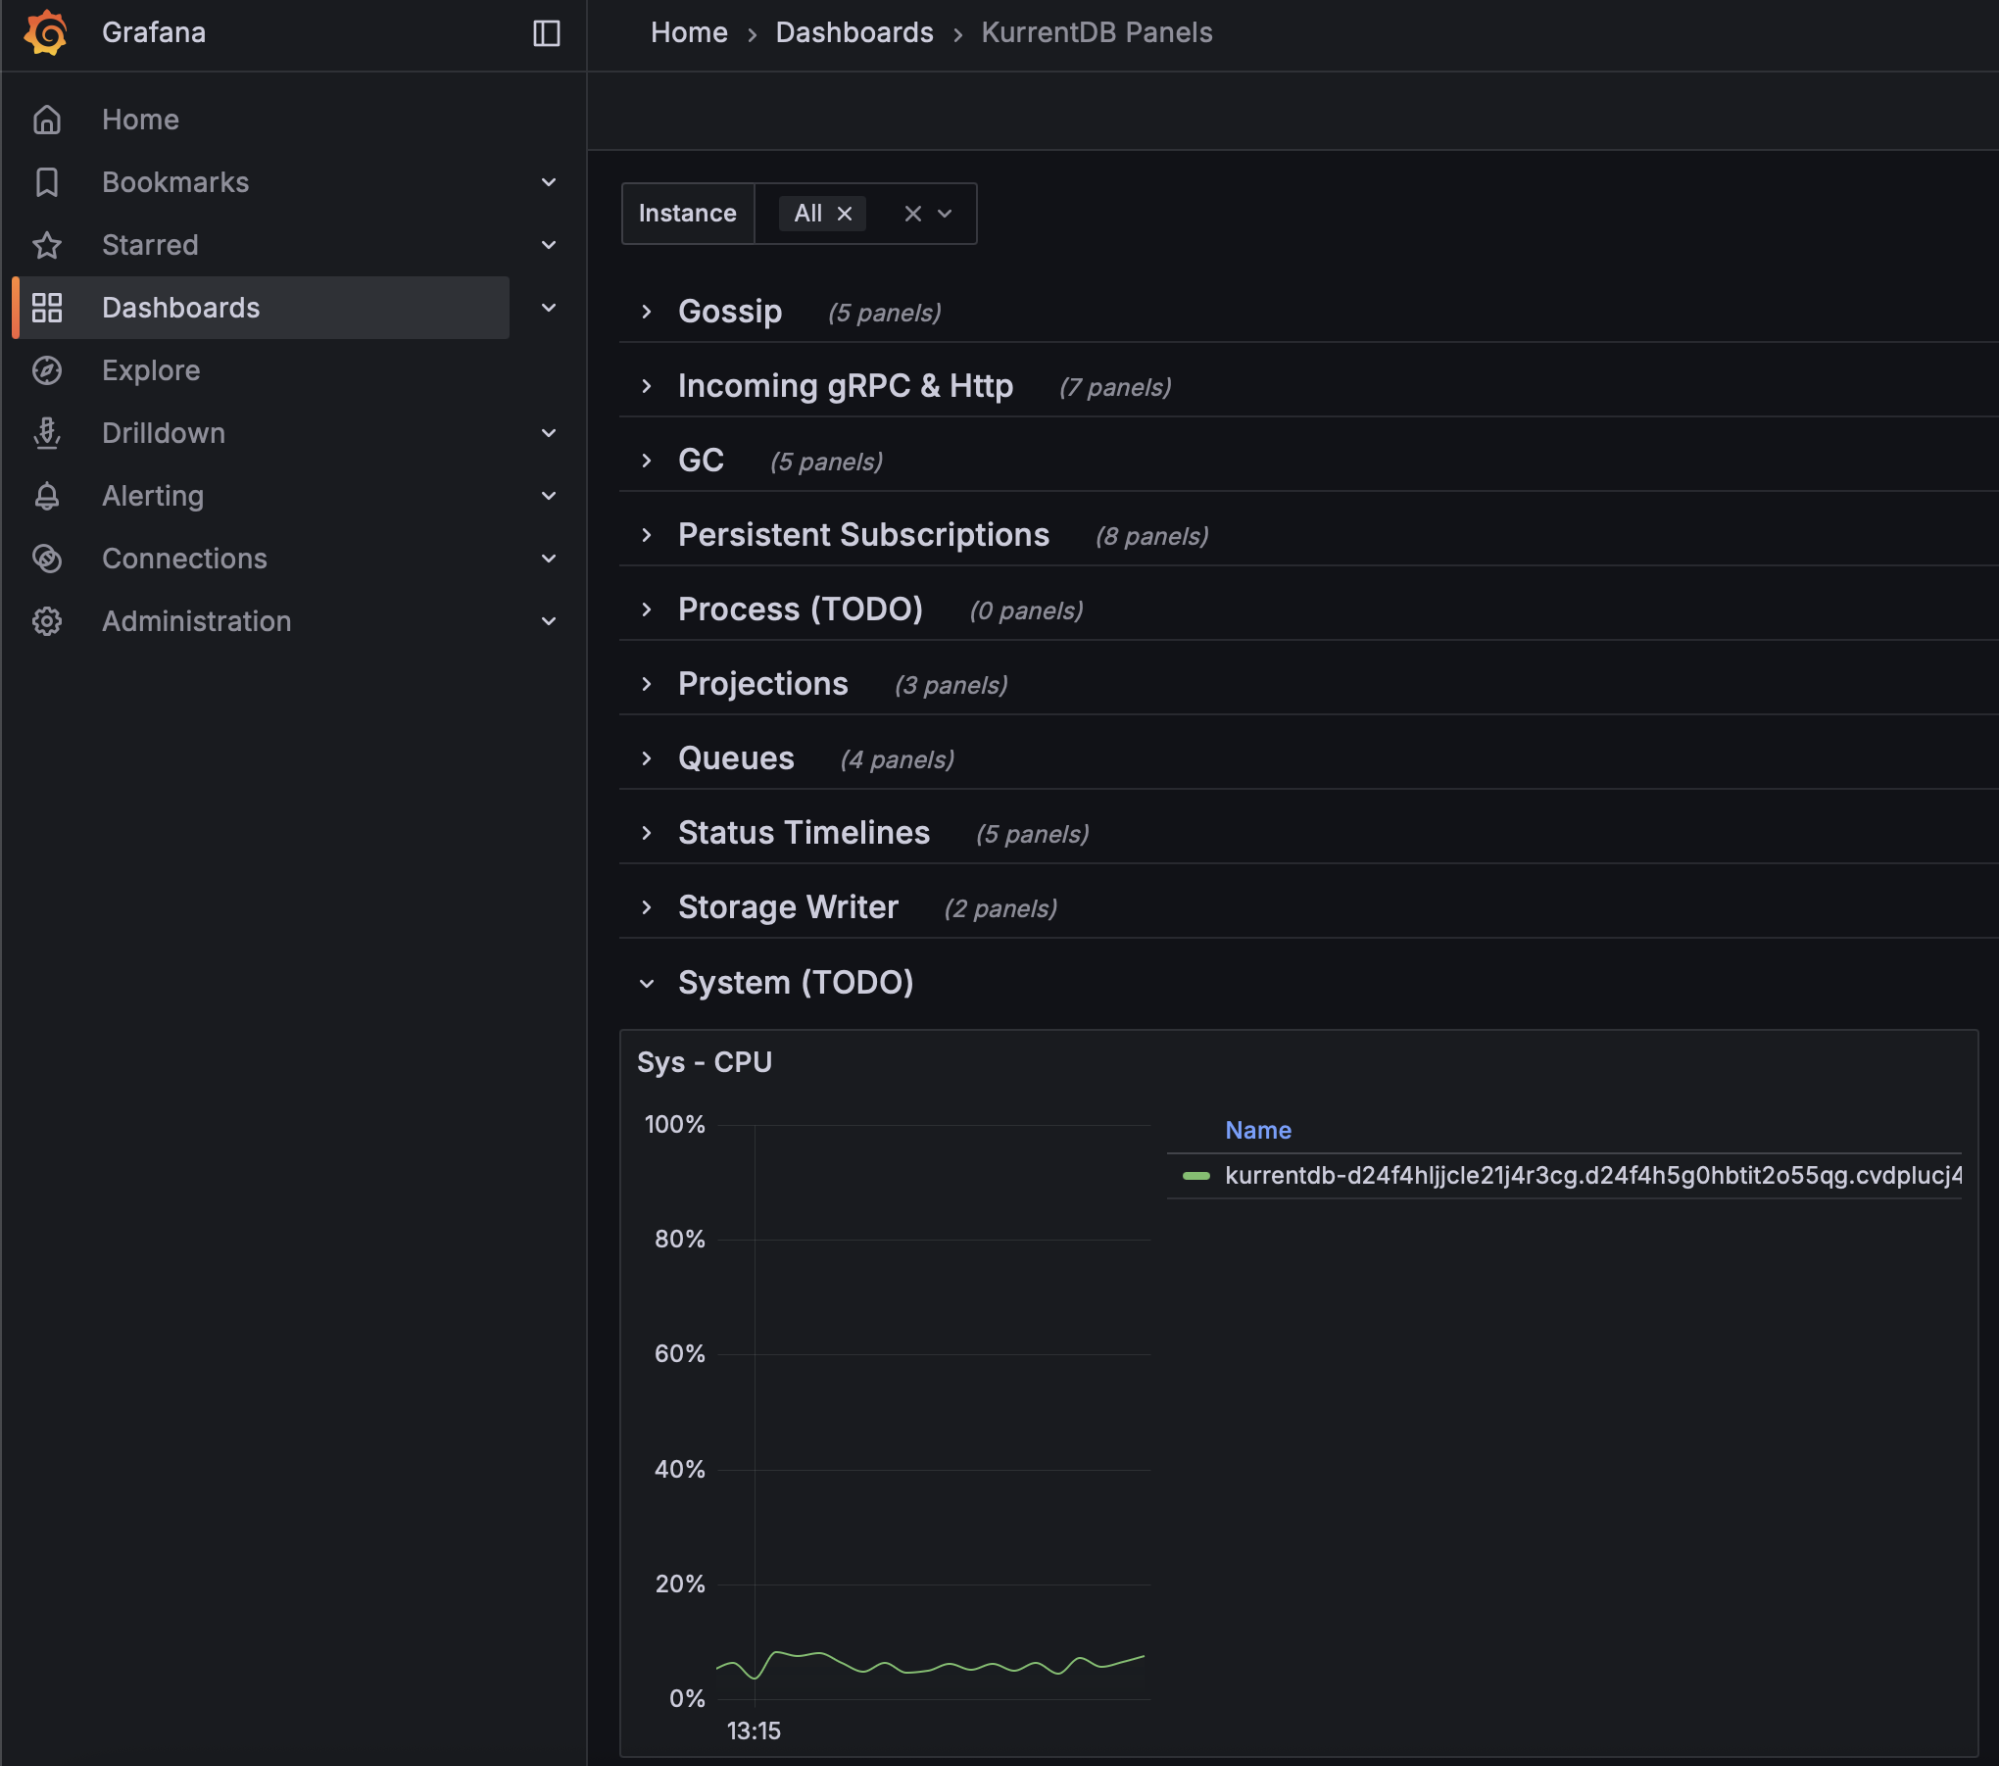
[64940, 1,07:15:04.489,INF] EventStore GC: 3 GENERATIONS IsServerGC: True Latency Mode: InteractiveCPU Utilization
To avoid thrashing, monitor sustained CPU utilization remains below 80%. This can be done at the operating system level, or on the Kurrent Grafana Dashboard
Disk Utilization
Kurrent recommends that organizations configure separate disk locations for logs, data, and indexes to avoid one impacting the other. Monitoring of these spaces should be at the operating system level. Ensure that log and data disk utilizations are under 90%. Index disk utilization should be under 40%, as additional disk space is required when performing index merges
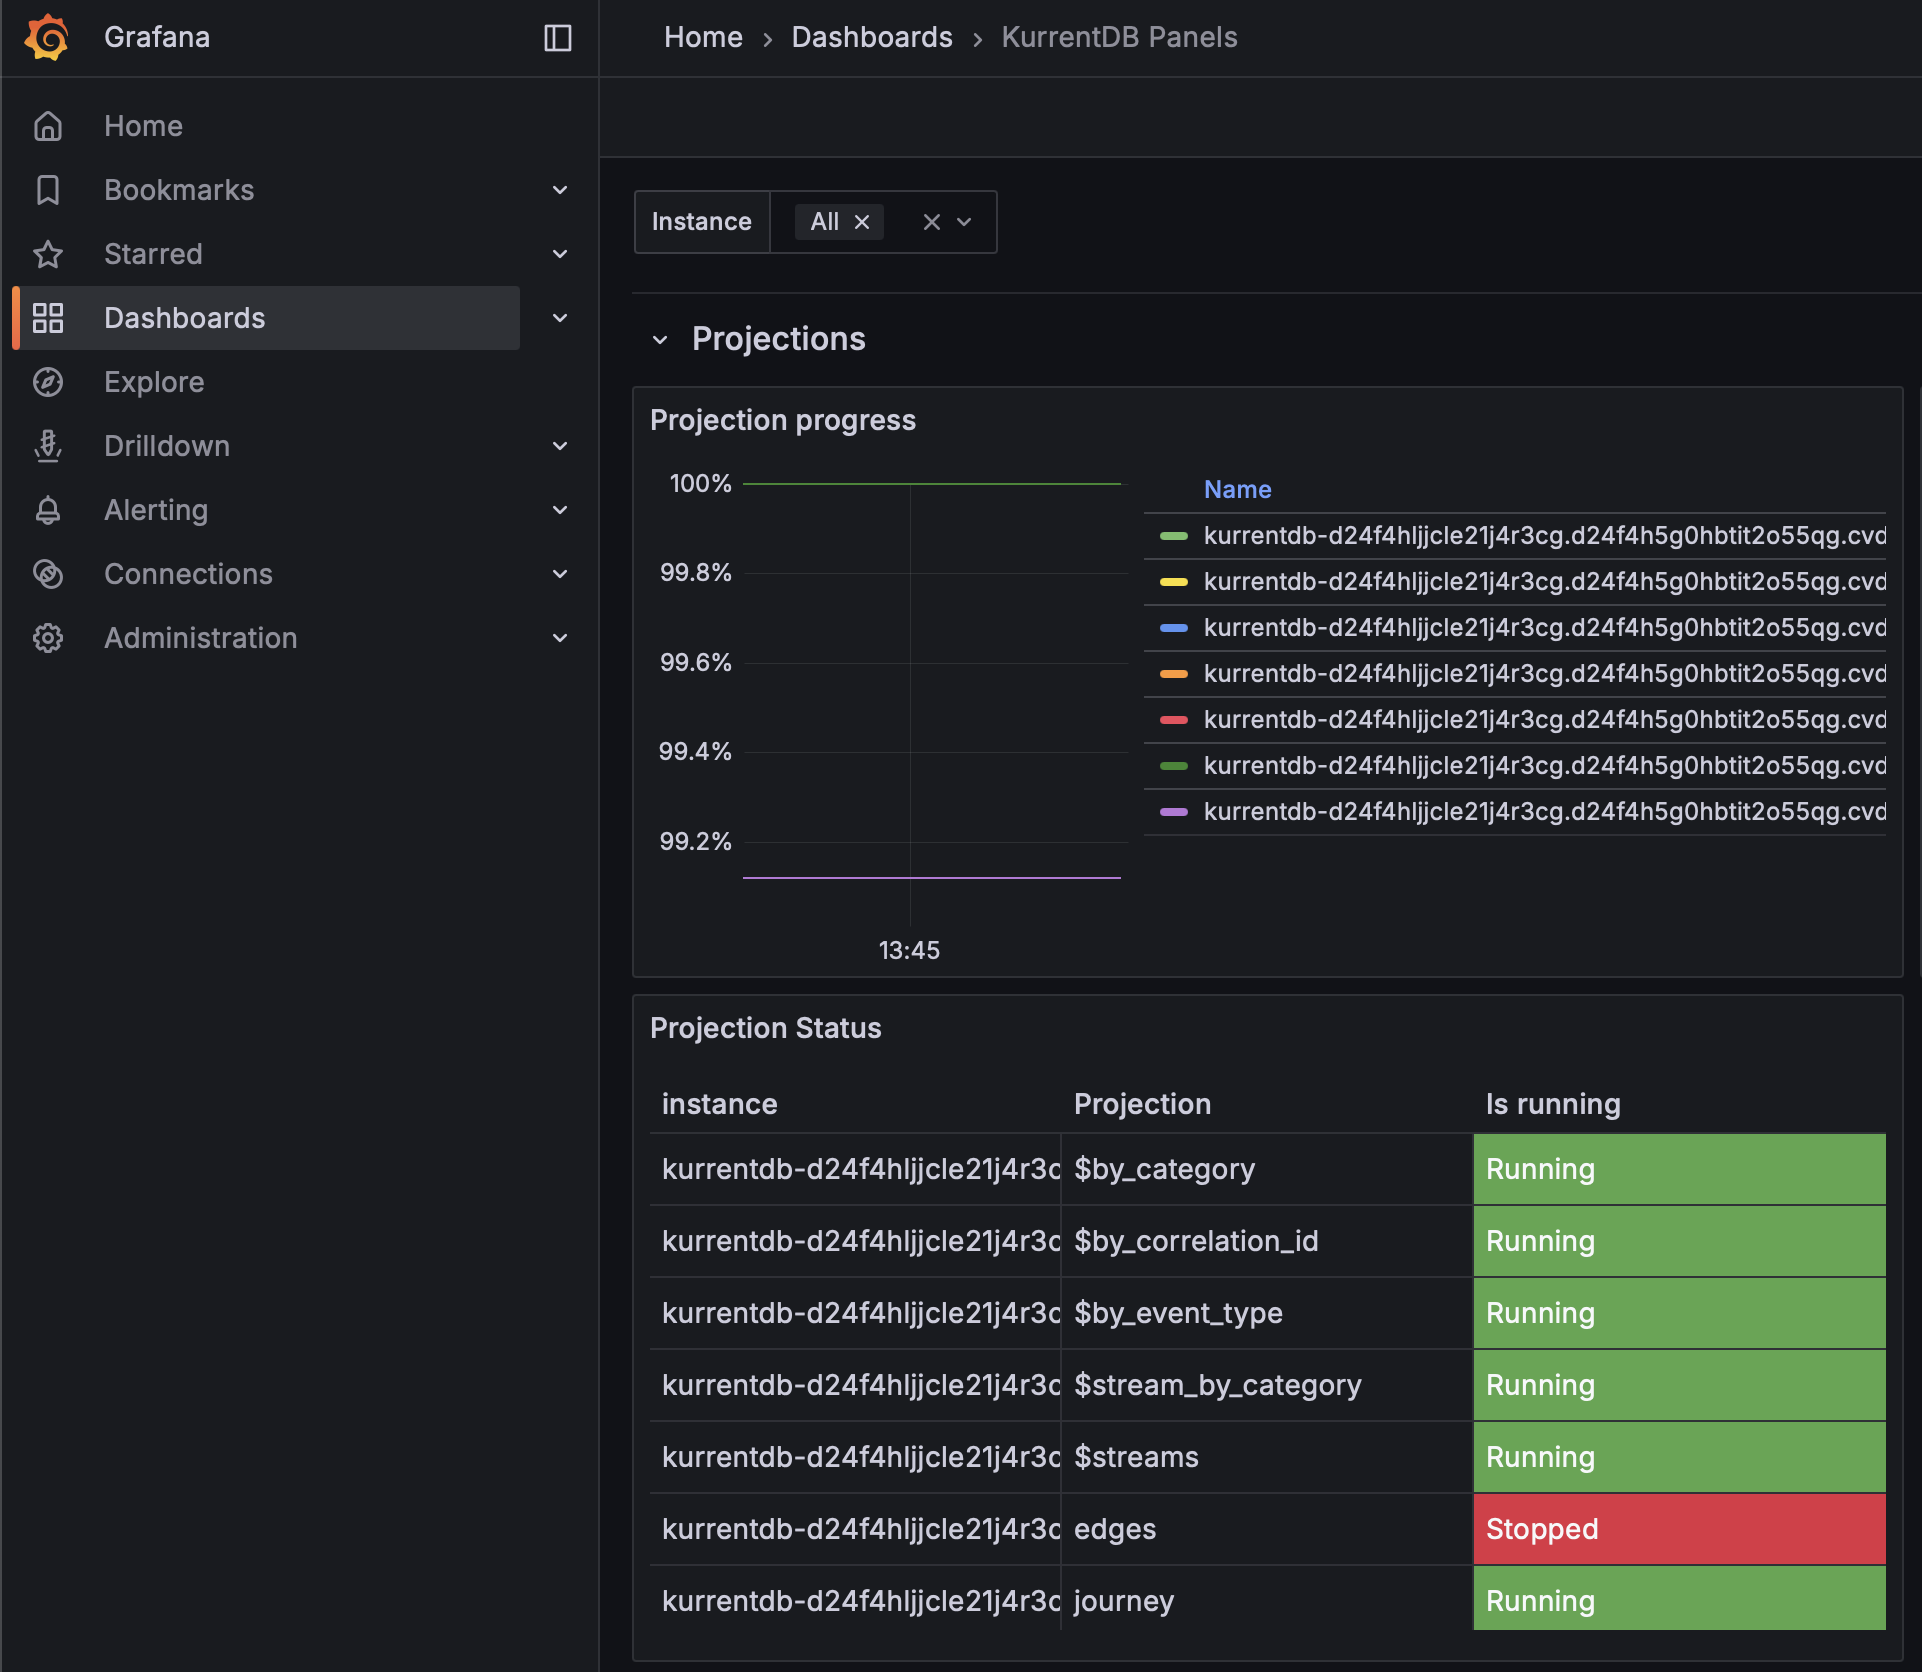
Projection Progress
Organizations should monitor the Kurrent Grafana Dashboard to ensure that the Projection Progress is close to or at 100% for each projection. This ensures that projections are not falling behind, and keeping pace with appends to the database
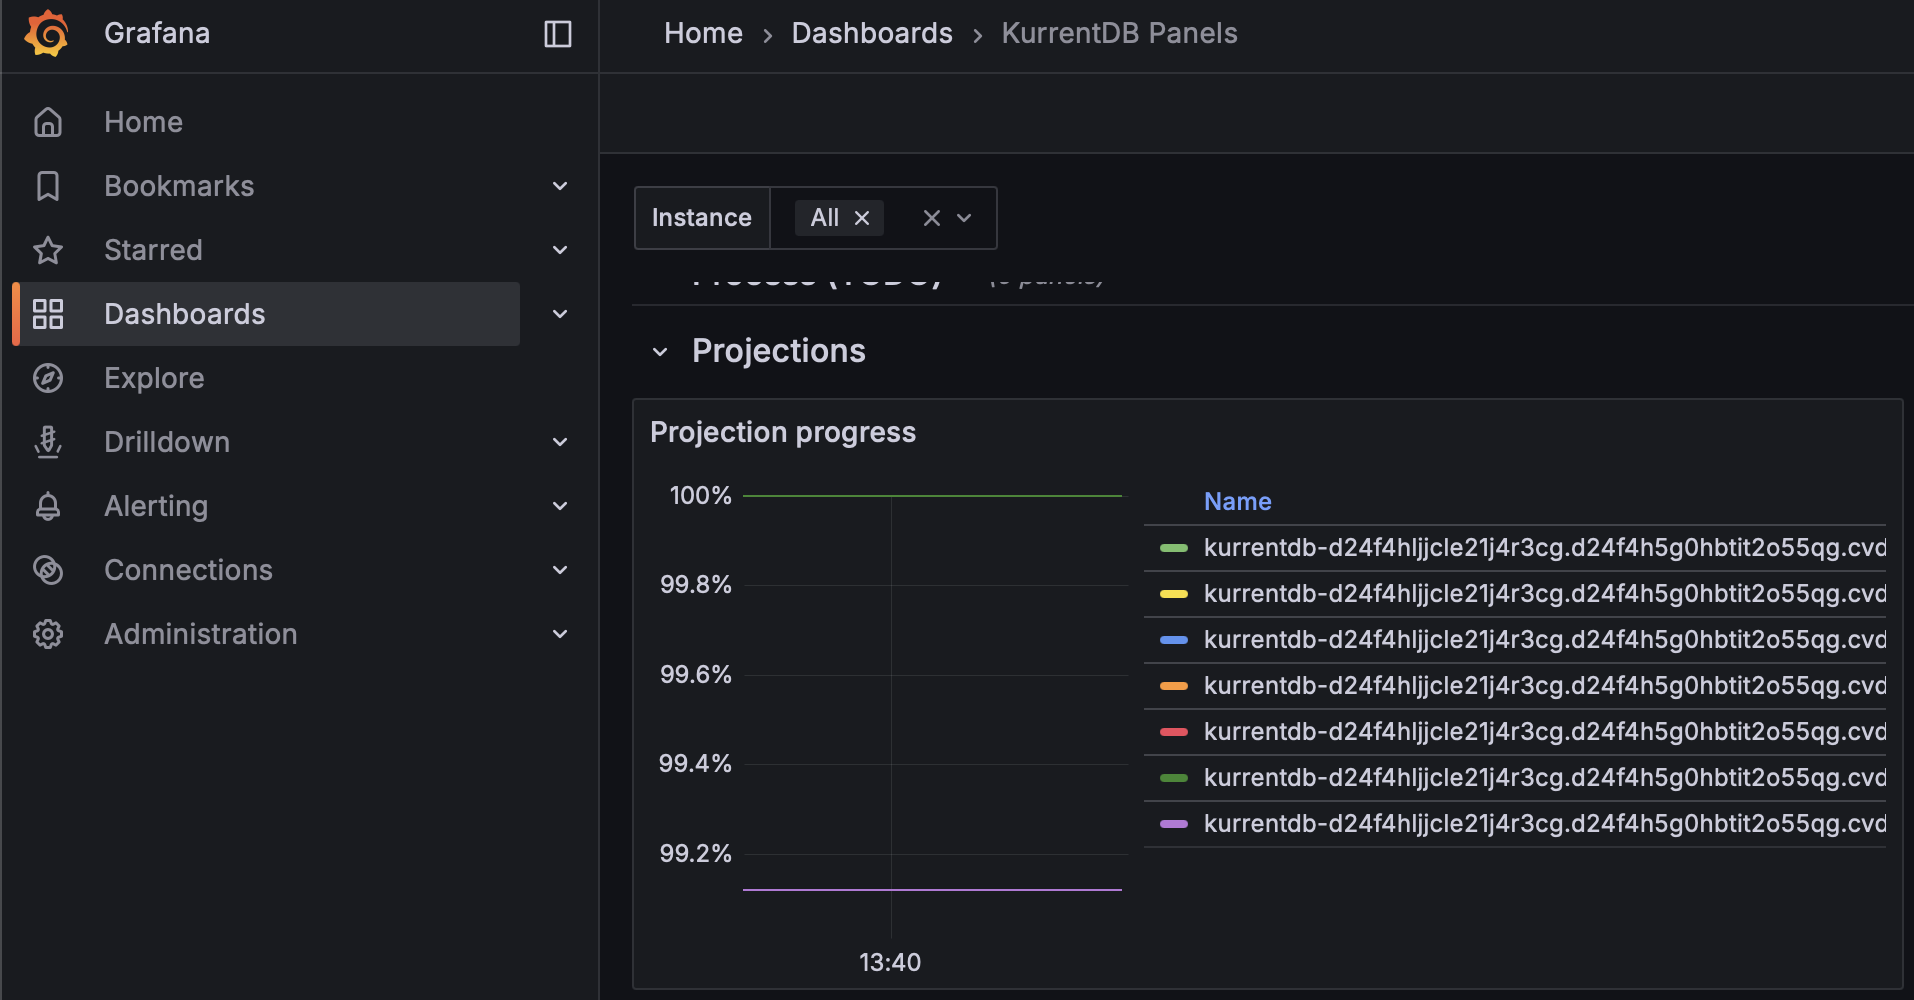
If your Projection Progress is decreasing, contact Kurrent Support for analysis and recommendations to mitigate
NOTE: On large databases, this metric could show as 100% but still in fact be far behind due to the number of significant digits when dividing large numbers
Stopped Projections
Stopped projections do not execute, and should be monitored to ensure all components of your database are operational. Use the Kurrent Grafana Dashboard to see which projections are stopped, investigate the cause, and resolve
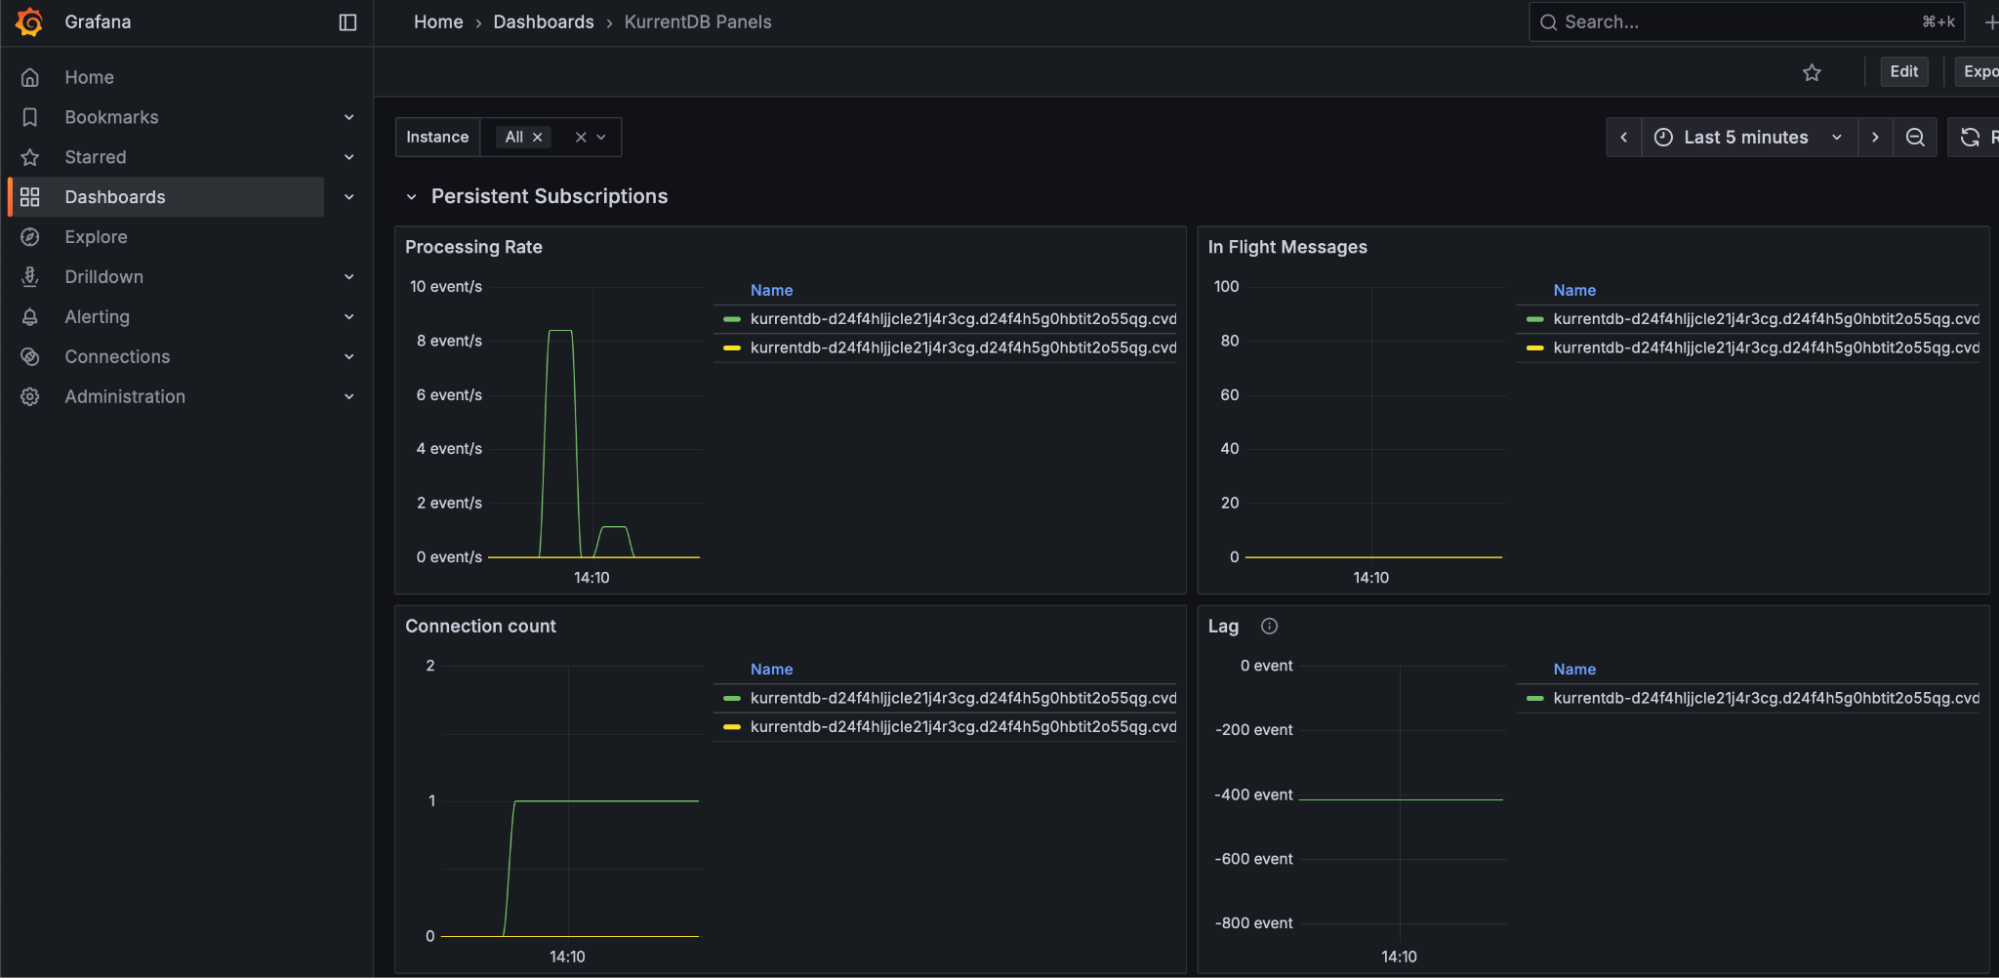
Persistent Subscription Lag
To ensure timely delivery of events to subscribers, we monitor Persistent Subscription Lag through the Kurrent Grafana Dashboard. Persistent Subscription Lag should be as close to 0 as possible to ensure that persistent subscriptions are caught up and checkpointed
Queue Times
Queue Times tell an organization how long an item is waiting to be processed. There are several queues, including Reader, Worker, Projection, Subscription, and more. Queue times should be monitored using the Kurrent Grafana Dashboard, ideally maintaining steady queue times with no large spikes or upward trend
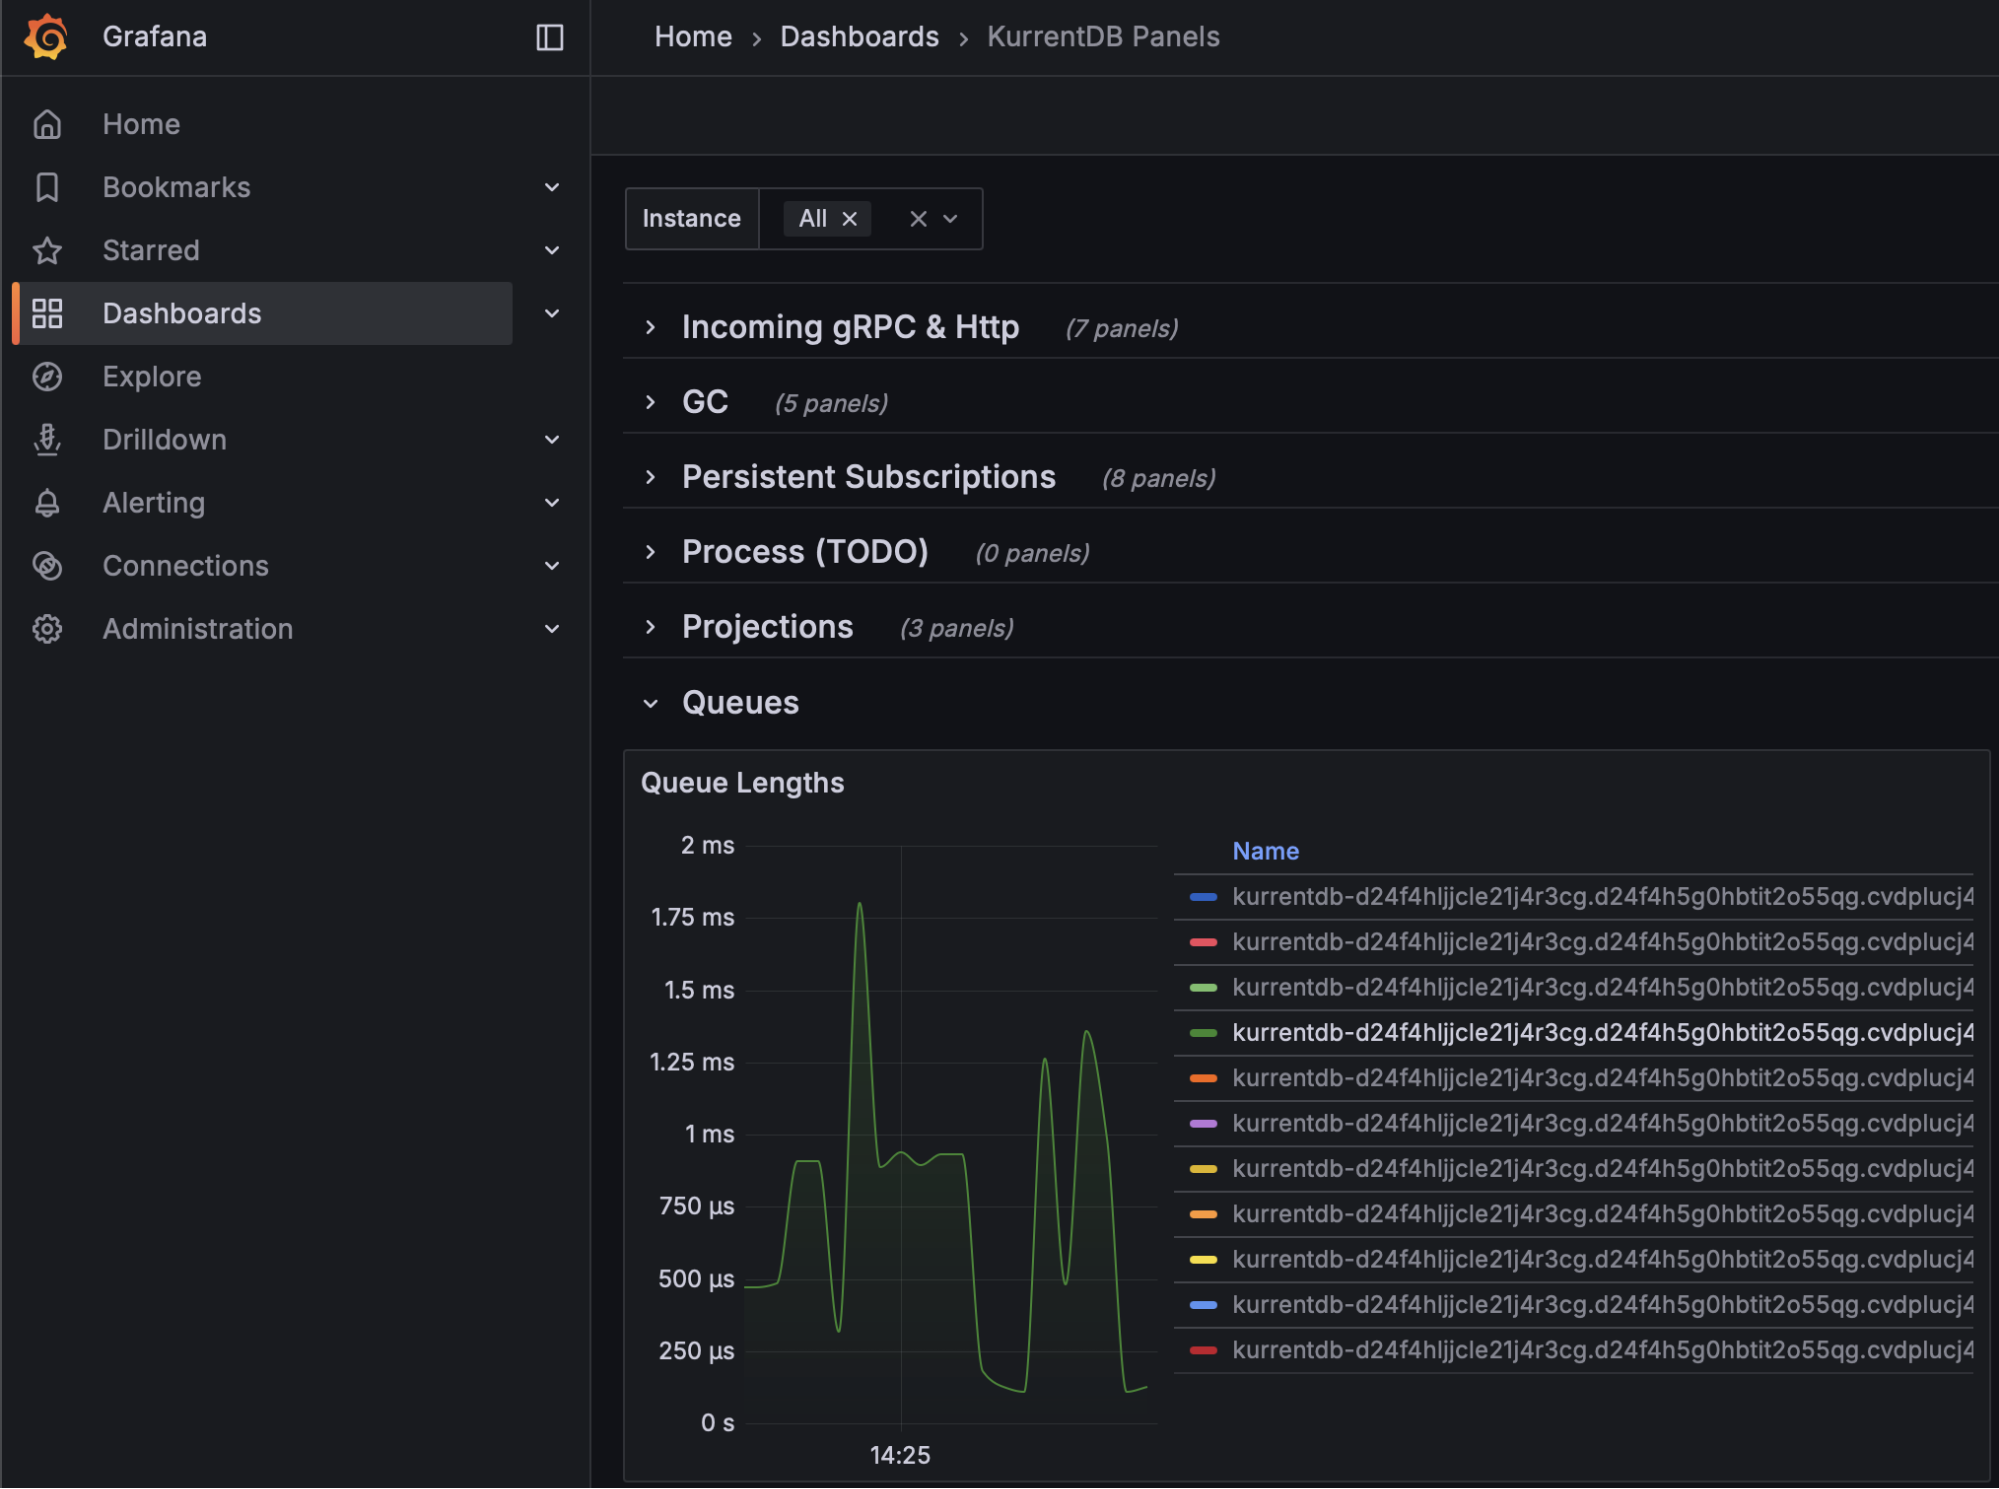
If your queue times are increasing, it may be a sign that your hardware is undersized
Cache Hit Ratio
KurrentDB maintains internal caches of stream names to speed up reads and writes. Use the Kurrent Grafana Dashboard to monitor Cache Hit Ratio, and aim for a value of 80% or above to ensure the right stream pointers are kept in memory for streams currently being read / written
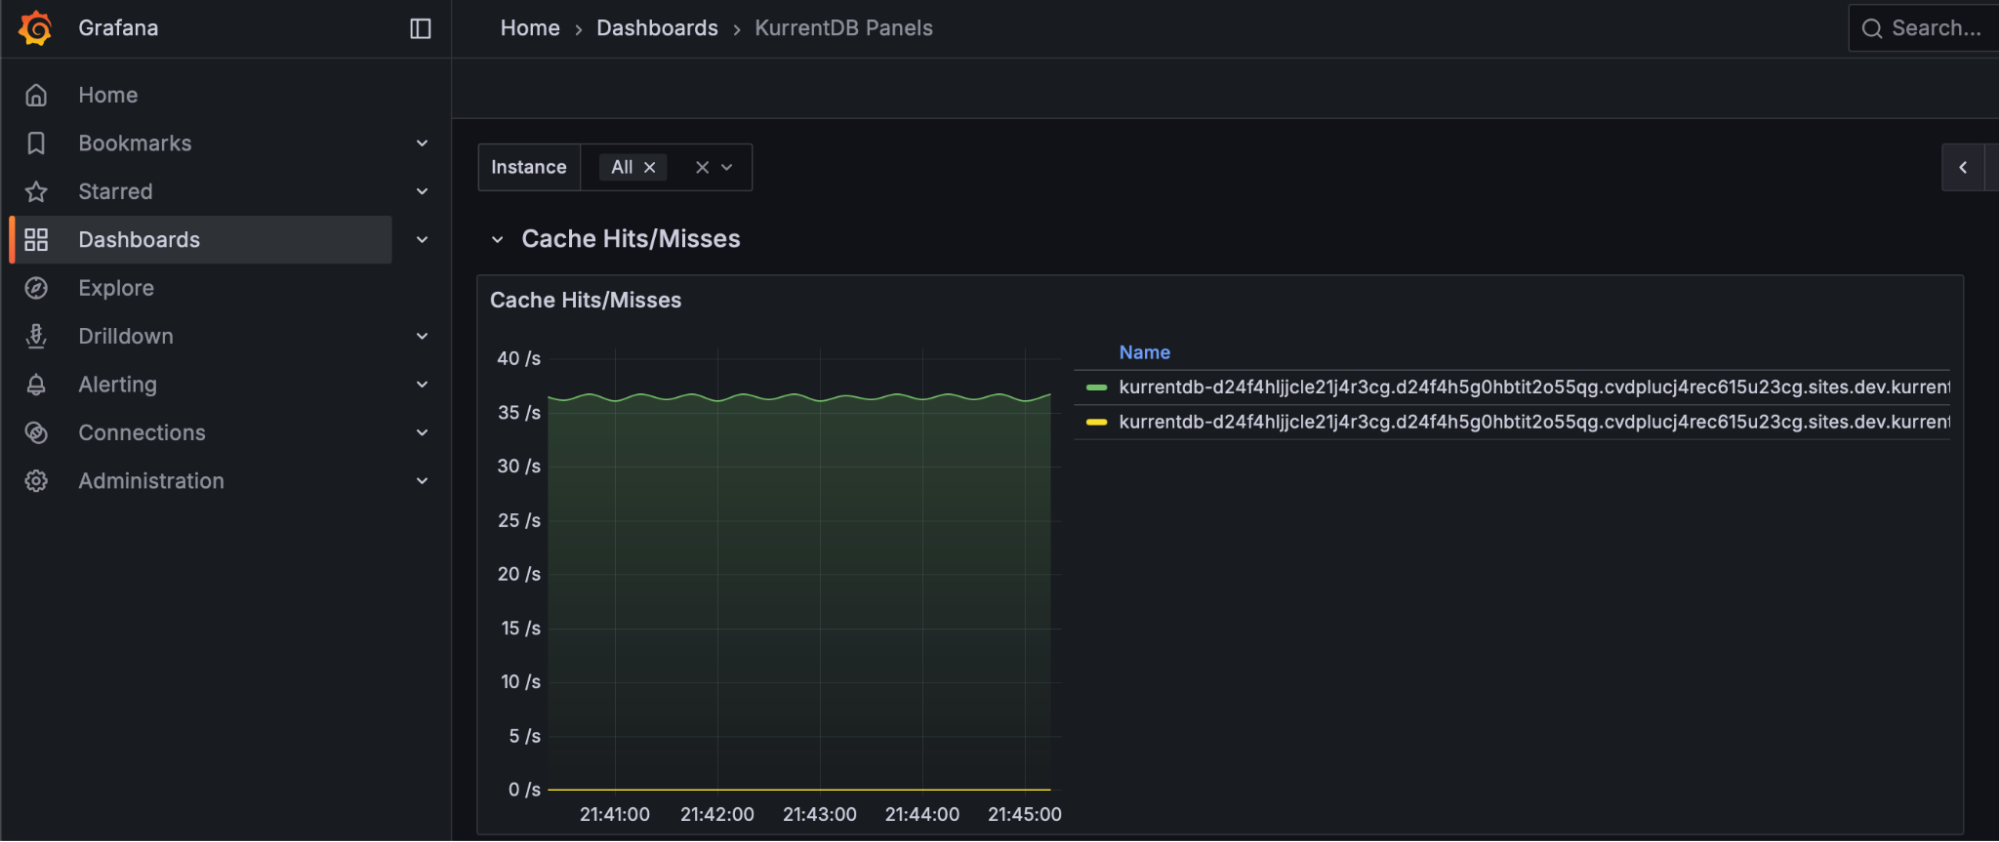
If your Cache Hit Ratio is below 80%, or declining, consider increasing the StreamInfoCacheCapacity configuration parameter to keep more streams in memory. Be aware that this can increase memory usage and GC pauses.
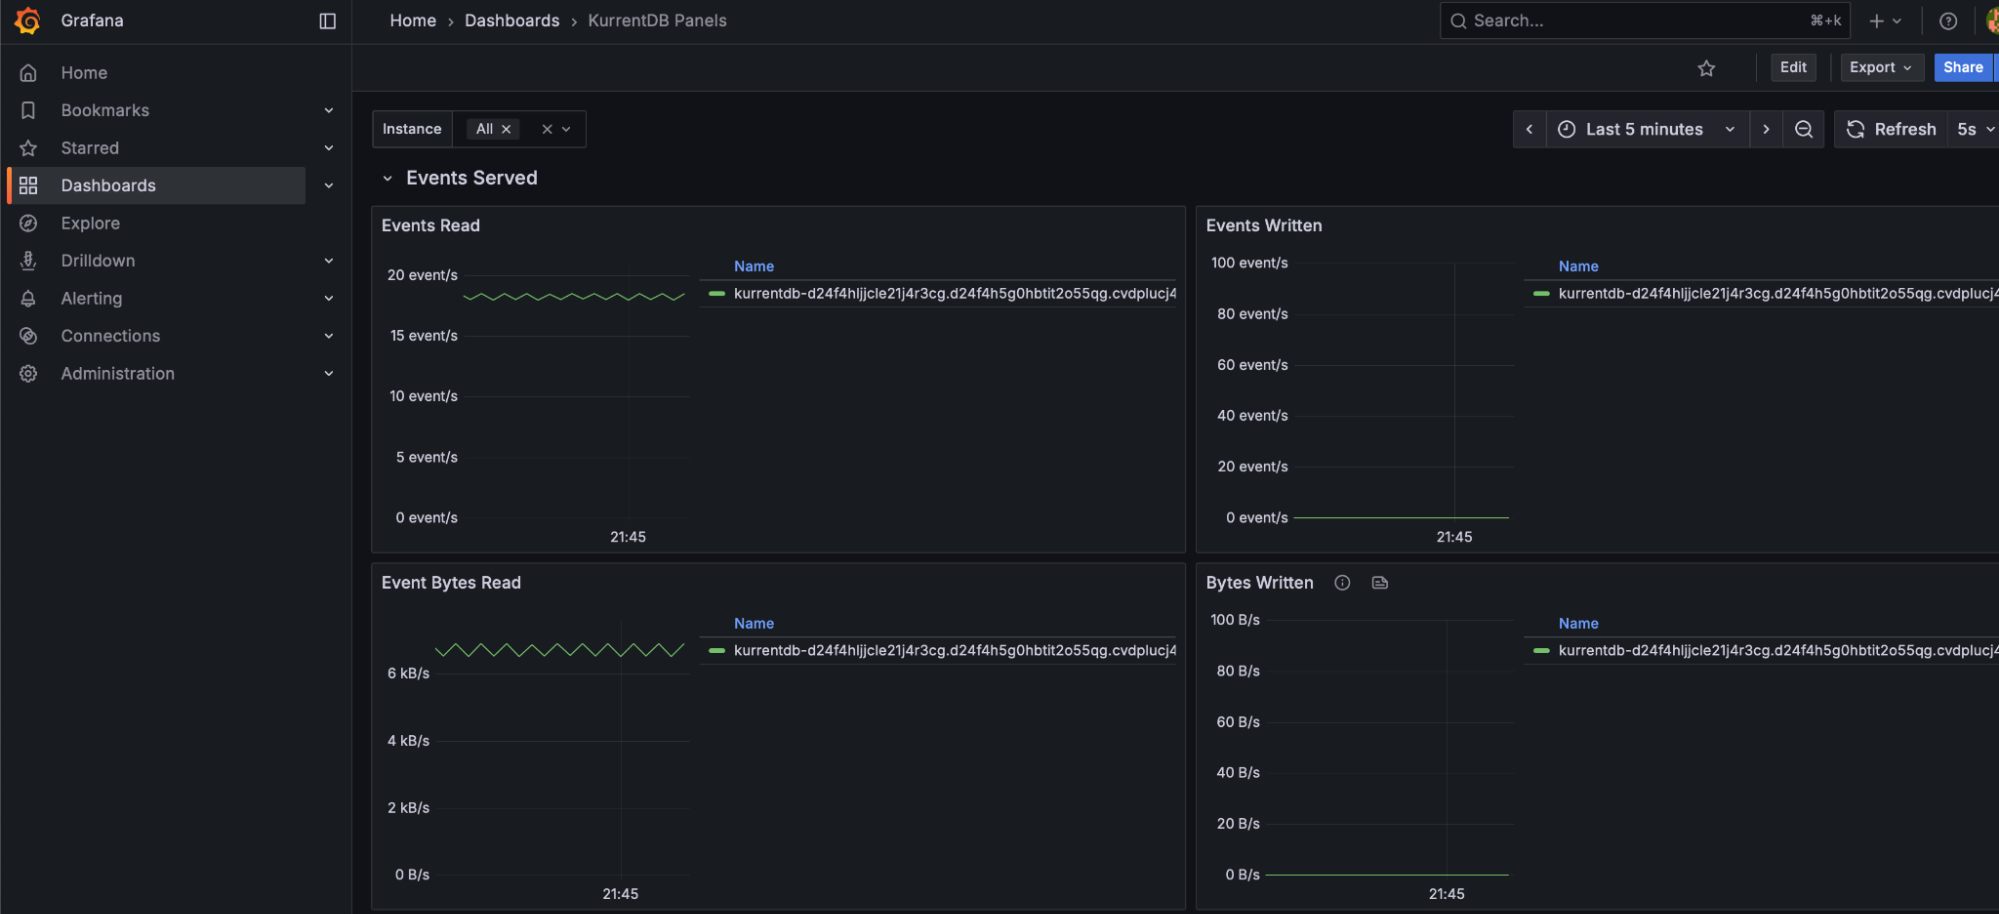
Bytes Read and Bytes Written
Bytes Read and Bytes Written metrics should be relatively even during regular processing, with minimal spikes indicating irregular load. Spikes in load may indicate upstream or downstream application issues, and cause uneven performance. NOTE: these spikes may also be innocuous and part of regular business process load changes
Persistent Subscription Parked Messages
The Kurrent Grafana Dashboard reports the number of Persistent Subscription Parked Messages, which may indicate processing or logic errors in persistent subscribers. This value should be as close to 0 as possible
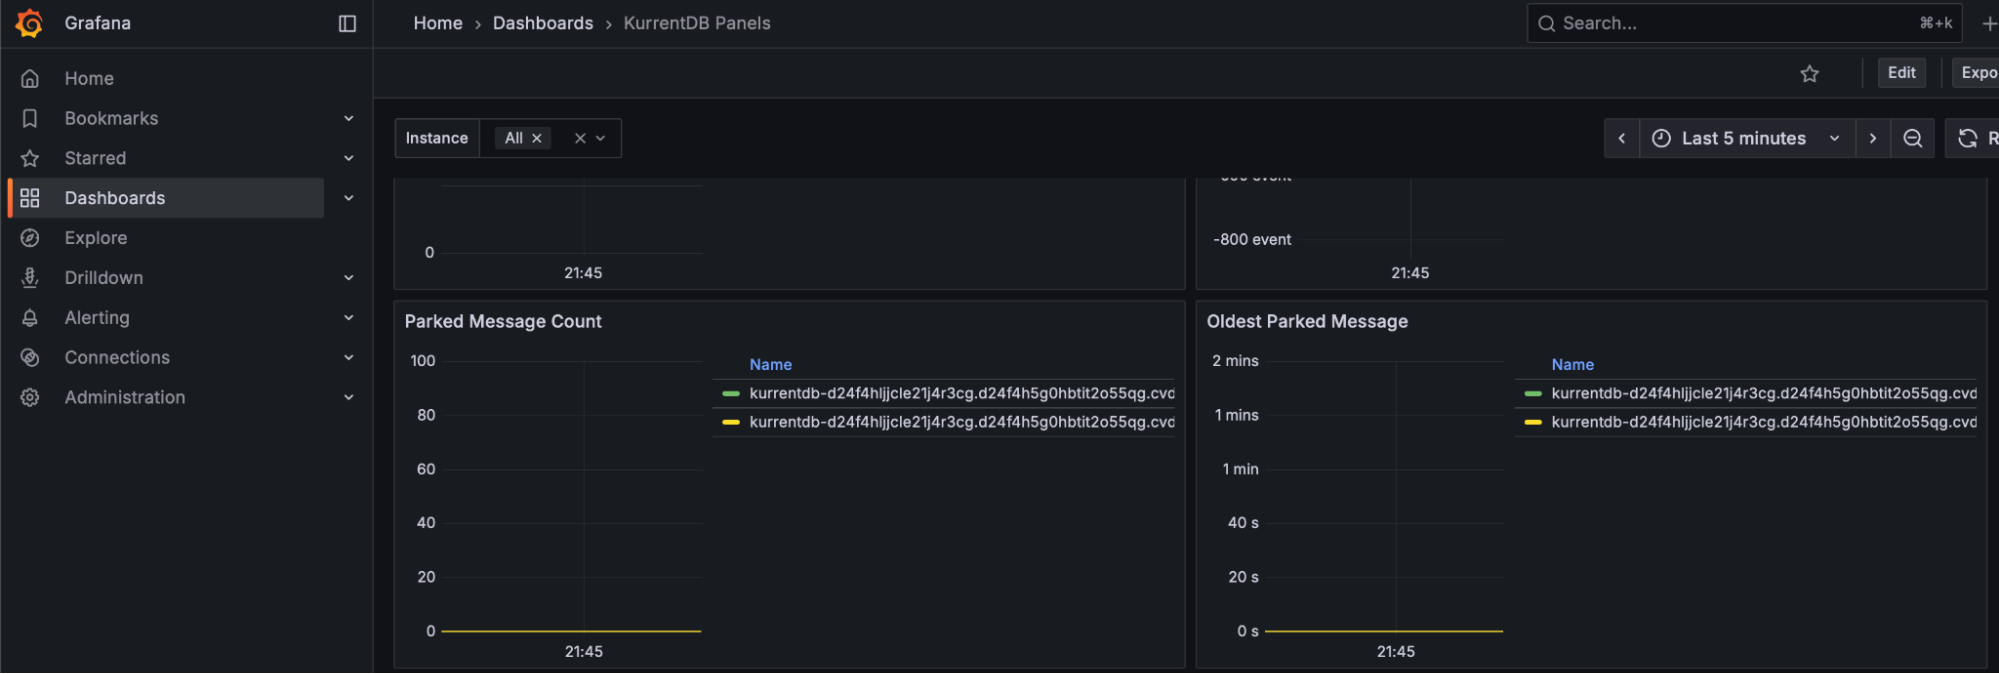
NOTE: These are events that cannot be handled by the application’s logic, and should be reported to the team responsible for application development for appropriate handling and resolution. These events can be replayed or deleted through the Kurrent Web UI or API, if required.
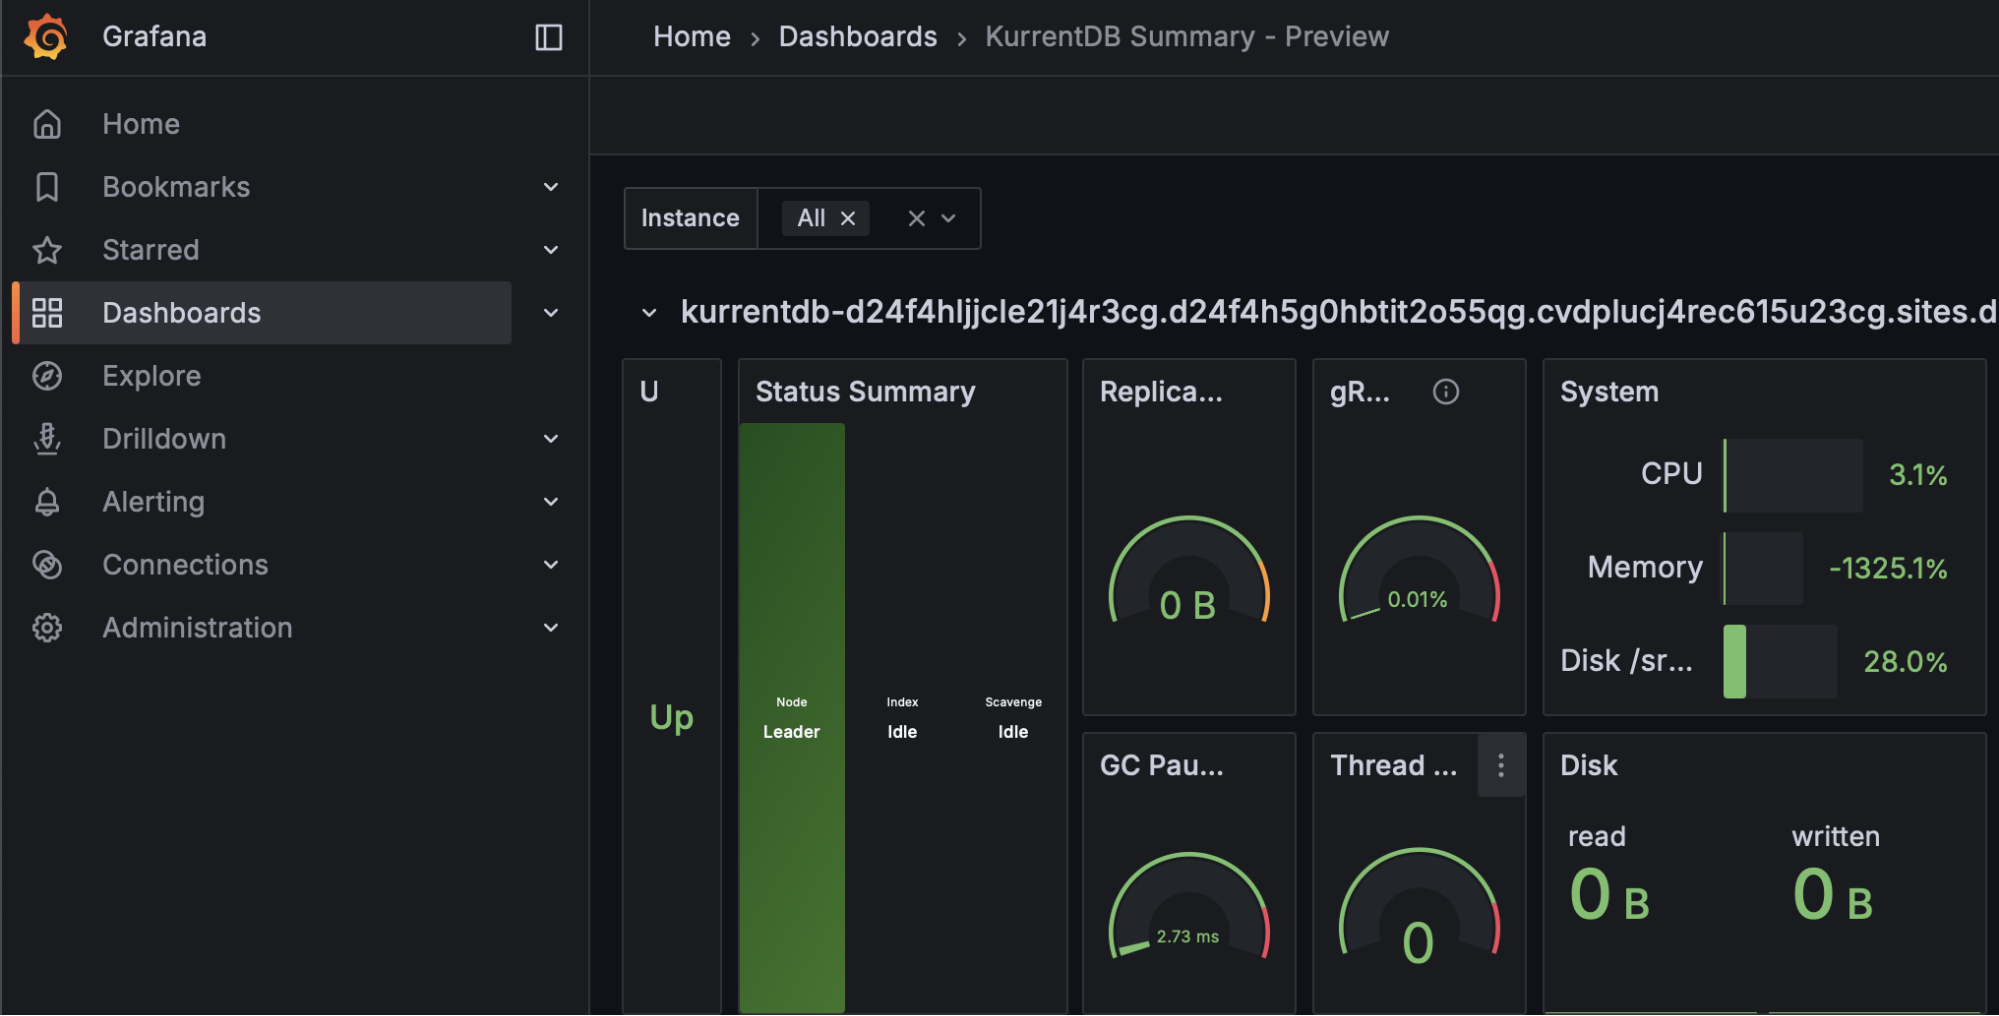
Node Status
Each cluster needs a Leader and Followers. The Kurrent Grafana Summary dashboard can show, at a glance, the status of each node in the cluster. Organizations should monitor to make sure there is always one leader, and two followers, available (for a 3 node cluster). The cluster will function correctly with only two nodes, but the situation should be rectified since with only two nodes available a further failure would cause an outage.
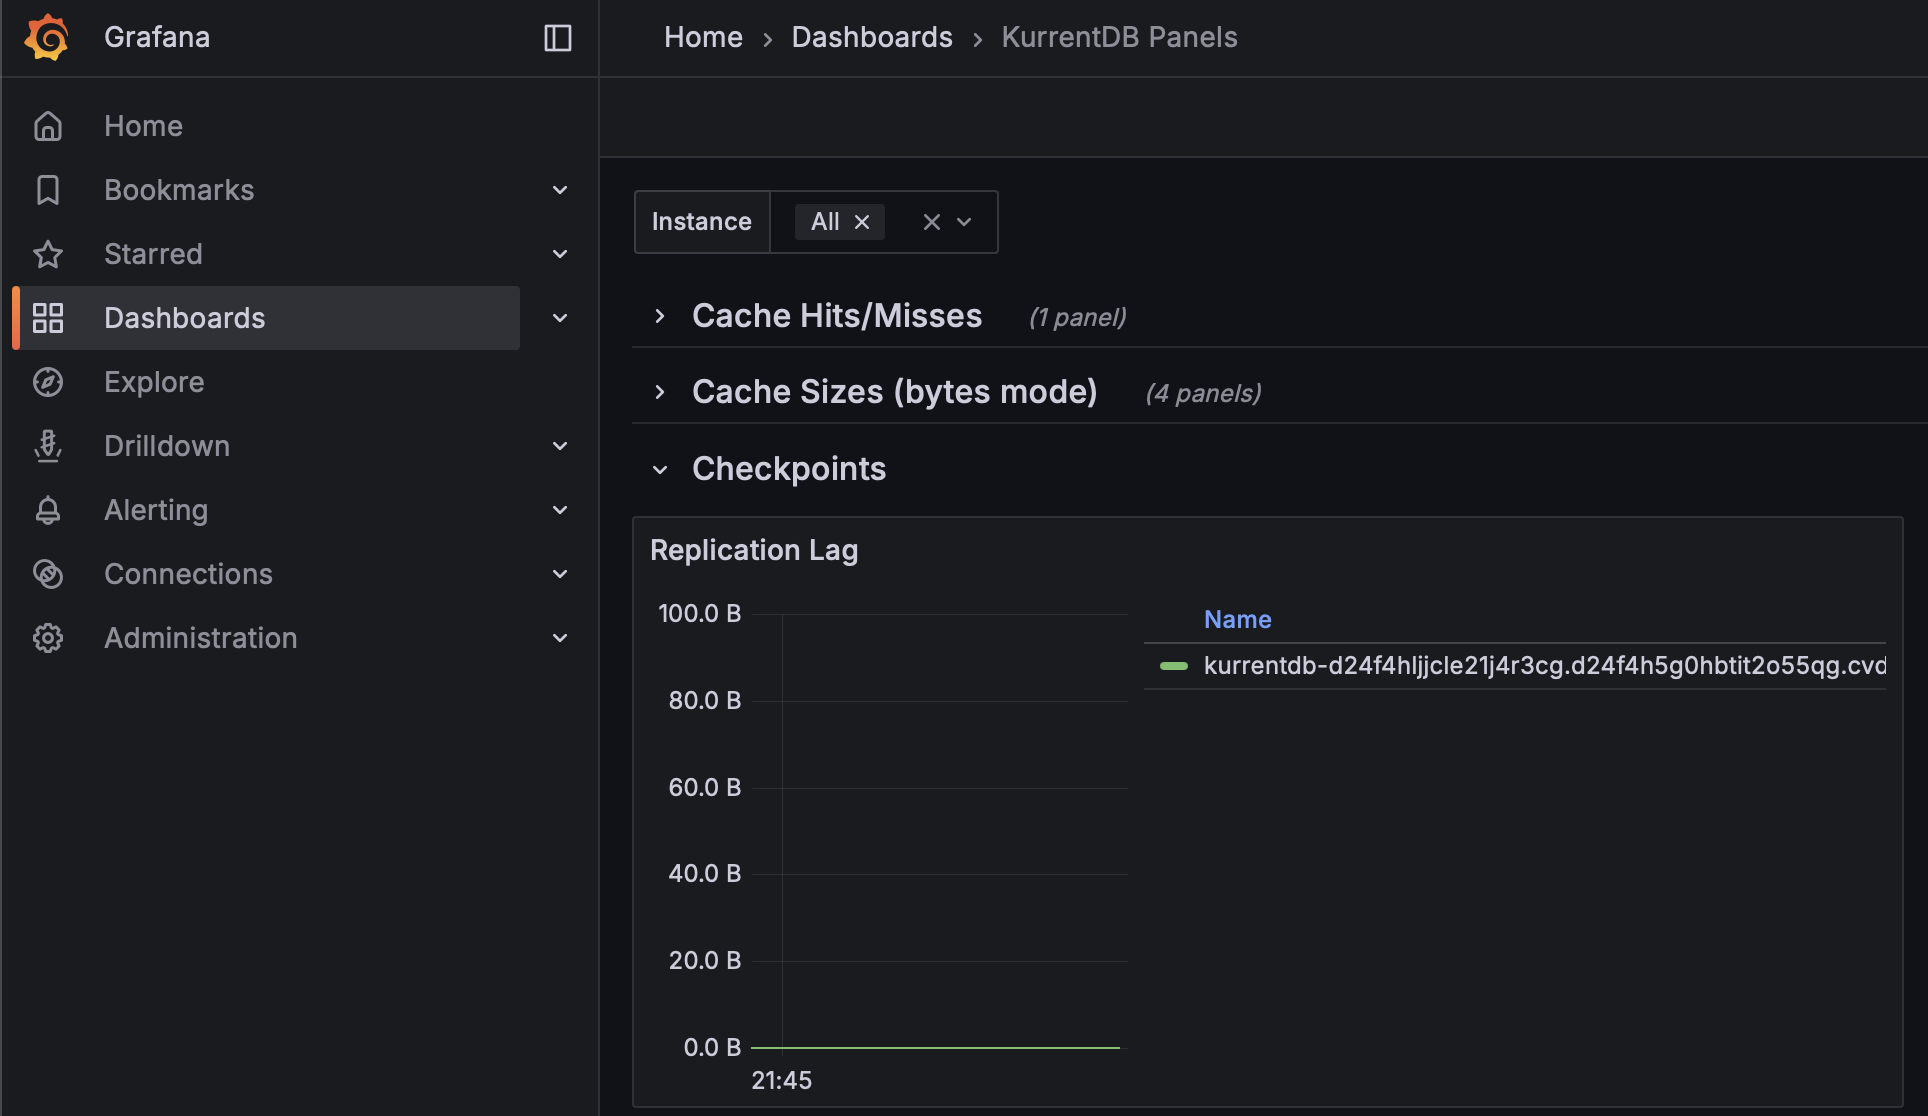
Replication Lag
In a cluster, events are always appended to the leader, and replicated to the follower nodes. Replication Lag between the leader and followers should be close to 0 bytes, and not increasing over time. Organizations should monitor the Kurrent Grafana dashboard Replication Lag and alert if this value is increasing as it is a sign that a follower is unable to keep up with the leader. When a node is restored from a backup, it will have a replication lag while it catches up. The lag should diminish to 0 over time.
Failed gRPC Calls
Failed gRPC calls can be monitored on the Kurrent Grafana dashboard, and indicate that a connection or database operation failed. Ideally, there are 0 failed gRPC operations of any kind, and failure could be indicative of a number of conditions from network issues, client issues, etc.
Conclusion
In this first part of our series, we’ve explored the critical metrics for monitoring the health of your KurrentDB cluster. From resource utilization like CPU, memory, and IOPS to internal processes such as projections, subscriptions, and replication, keeping a close watch on these indicators is the first step toward a stable and performant system. By setting appropriate thresholds and alerts, you can proactively address potential issues before they impact your services.
What’s Next in Part 2?
Metrics tell a big part of the story, but not the whole story. In part 2, we will shift our focus to log-based monitoring. We’ll discuss how to analyze KurrentDB logs to uncover deeper insights, diagnose complex problems, and set up effective log-based alerting. We’ll also cover general tips and best practices for maintaining overall cluster health.
Further Reading
Please see the following Kurrent resources for more information
